 APTF
APTFForex trade journal
A forex trade journal differs from an ordinary terminal statement by one field: your state before the entry. The statement already knows the price, the size and the result — that is enough to judge the strategy, but not enough to judge yourself. How to keep a journal so that it answers the second question is what this page is about.
Forex trade log: nine fields of the record
The first four are pulled from the terminal automatically if you export a statement. The value of a journal is created by the other five — they have to be written by hand, and that is exactly why they are the ones most often skipped.
| Field | What to write | Why |
|---|---|---|
| Date and time | From the statement | Link to the session and to fatigue |
| Instrument | From the statement | A check for going outside the list |
| Size and stop | From the statement | Control of risk per trade |
| Result in R | Result ÷ size of the risk | Comparability between trades |
| Setup | The name from the plan | Statistics by type of entry |
| By the rules | Yes / no, naming the point that was broken | Calculation of the rule-following share |
| State before entry | Calm / rushing / want to win it back / tired | The link between state and result |
| What you expected | One sentence before opening the position | Protection against explanations after the fact |
| What you would do differently | One sentence after closing | Material for the monthly review |
A forex trader's journal differs from an equities log by two lines: alongside size and stop it makes sense to keep the distance in points and the number of nights in the position — a swap is charged for each one.
The «what you expected» field is filled in before the entry. It is the only protection against hindsight bias: by tomorrow memory will rewrite the story as though you had foreseen everything, and the review will lose its point.
What to calculate from the journal once a month
Four indicators are enough. More is harmful: excess statistics on a small sample produce false patterns.
The main quantity of the section. Calculated as the ratio of trades without violations to all trades. A working level is from 90 %, at the start 50 % happens.
executionSeparately for trades that followed the rules and separately for the violations. The difference between the groups is exactly the price of your indiscipline in money.
the price of violationsIf the first is smaller, the disposition effect is at work: profits are cut, losses are sat through.
exitsThe result broken down by the «state before entry» field. Usually one or two states produce almost the whole minus, and they are not always the ones you assumed.
leading scenarioA worked review: what a sample of 40 trades shows
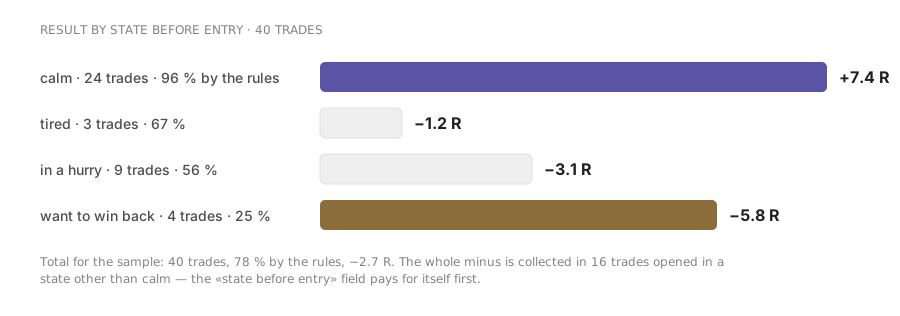
A model sample, but the proportions are typical. The point is to show how a specific conclusion comes out of an ordinary table.
| State before entry | Trades | Of them by the rules | Share by the rules | Result, R |
|---|---|---|---|---|
| Calm | 24 | 23 | 96 % | +7.4 |
| Rushing | 9 | 5 | 56 % | −3.1 |
| Want to win it back | 4 | 1 | 25 % | −5.8 |
| Tired | 3 | 2 | 67 % | −1.2 |
| Total | 40 | 31 | 78 % | −2.7 |
The conclusions are read straight from the table. First: the strategy itself is profitable — in a calm state, plus 7.4 R for the month. Second: the whole minus is created by sixteen trades out of forty, and four «want to win it back» trades cost more than the other twelve together. Third: the work has to go not into the strategy and not into emotions in general, but into one specific scenario — revenge trading.
Why this matters more than general advice. Without such a table a person in this situation usually does the exact opposite: starts changing the strategy, which is the part that works. A journal is needed not for discipline for its own sake, but to point the effort where it pays off.
What to keep it in, and why the format hardly matters
Three workable options
The choice of tool does not affect the result, whereas the presence of a «state» field affects it decisively. If a service does not support it, a short text field with four options is enough — that is sufficient for a pivot table.
Five mistakes in keeping one
A ready table structure: what goes in which column
For a journal to be calculated rather than merely filled in, the columns have to be machine-readable: values from a list rather than free text. Below is a structure from which pivots are built in one move.
| Column | Value type | Example | What is calculated from it |
|---|---|---|---|
| Date and hour | date | 12.03, 11:40 | Result by hour of the day |
| Instrument | list | EURUSD | Share of trades outside the list of pairs |
| Setup | list | bounce off a level | Statistics by type of entry |
| Risk, % | number | 1.00 | Spread of risk between trades |
| Result, R | number | +2.0 | Expectancy and group averages |
| By the rules | yes / no | no | Rule-following share |
| Point broken | list | size | Which rule breaks most often |
| State before entry | list | rushing | Result broken down by state |
| Expectation before entry | text | to the 1.0880 level | Protection against explanations after the fact |
The key requirement is that the «state» and «point broken» columns must be lists of four to six fixed values, not a text field. Free text cannot be grouped, and without grouping a journal stays a journal rather than a measuring instrument.
expectancy = mean(result, R) over all trades
price of indiscipline = sum of R on violations × risk in money
The Saturday review: a twenty-minute procedure
A journal without a regular review turns into an archive. Below is the procedure that lasts the longest, because it is short and has a fixed set of questions.
Number of trades, rule-following share, result for the two groups. Three numbers, two minutes.
2 minutesOpen the chart and see whether it was by the rules. If it was, there are no conclusions to draw: it is a planned cost.
5 minutesGroup by the «point broken» column. Usually one point leads, not all of them at once.
3 minutesA pivot on the «state before entry» column. We look for the state that produces the whole minus.
3 minutesOne line: what exactly you will change next week. Not five lines — one.
2 minutesEdits to the rules themselves accumulate until the monthly review. What changes weekly is behaviour, not the system.
0 minutesWhy only one change. If you change three things at once, in a month you will not be able to say which of them had the effect. One change a week is forty-eight verified changes a year, and that is noticeably more than most people manage to hold.
Frequently asked questions
How do you keep a trade journal if there are many trades?
With dozens of trades a day a full journal is impossible and unnecessary. The working option is full records per session rather than per trade, plus full records for every trade where there were violations. The second part is mandatory, because it is what gives you the rule-following share.
Is it mandatory to record emotions?
It is mandatory to record your state, not your emotions. The difference is practical: «anxious» is a poor record because it is not tied to an action; «rushing, afraid of missing it» is a good one because it explains why a checklist point was skipped.
How long before a journal starts being useful?
The first conclusions appear at thirty records, stable ones at a hundred. Below thirty trades the spread covers any pattern, and the review turns into fortune-telling from the last three cases.
What to do with old records?
Keep them and once a quarter compare the rule-following shares month by month. That is the only way to see that discipline is genuinely growing rather than merely seeming to after a good week.
Read next
