 APTF
APTFForex trader's calculators
Six forex trader's calculators and a twenty-point test turn psychology into numbers. All of them compute in the browser, nothing is sent anywhere, and each has the formula next to it — you can repeat it in your own spreadsheet and check it. None of them forecasts income: they show the mechanics, not the future.
Which calculation answers which question
- «It feels as though the system is broken — four stops in a row»
- Losing streak: shows how ordinary such a run is over your distance.
- «How many winning trades do I actually need?»
- Break-even win rate: the threshold at your risk/reward ratio and costs.
- «I am down a third, how long to recover?»
- Cost of a drawdown: the growth required and the number of trades at your expectancy.
- «What happens if I double size after a loss?»
- Cost of revenge trading: a step-by-step calculation compared with constant risk.
- «Is my risk per trade a lot or normal?»
- Risk of ruin: the probability of reaching a given drawdown.
- «What do the extra trades cost?»
- Cost of overtrading: spread, commission and swap per month and per year.
- «Which breakdown scenario is mine?»
- Map of your breakdowns: twenty statements and a split across five groups.
- «None of this has been calculated yet»
- Start with the losing streak: it needs only your win rate and immediately answers the most common question — is the system broken or is this a routine run.
Forex calculators online: rules common to all the calculations
On every page the formula is given in full, with the numbers substituted. If a result looks strange, it can be checked by hand.
verifiabilityEvery parameter the answer depends on sits on its own slider. A constant hidden inside a model goes out of date silently and substitutes the result in a way that cannot be seen from outside.
transparencyNone of the numbers you enter is sent to a server: the script computes in your browser.
privacyWhere a simulation over random scenarios is required, the generator runs with a constant seed. Otherwise moving a slider back and forth would produce different numbers.
reproducibilityWhat inputs are needed and where to get them
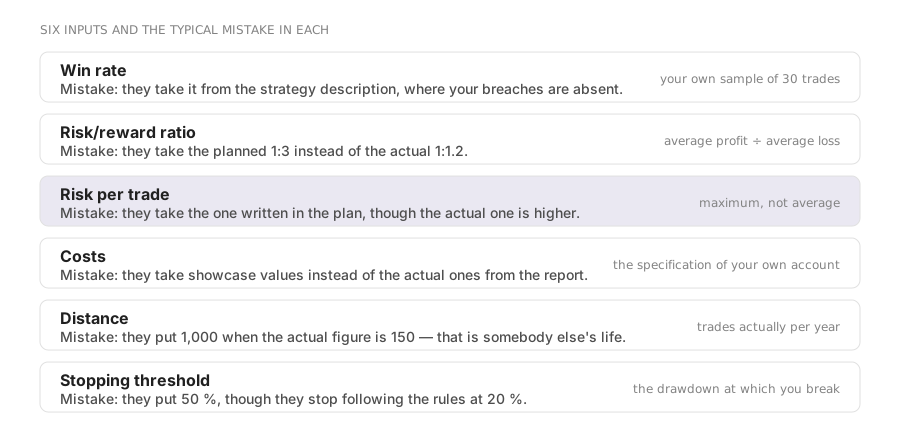
All the calculations run on one set of inputs. You cannot take them out of your head — or rather you can, but then the result will describe an imaginary system rather than yours.
| Input | Where it comes from | Typical mistake |
|---|---|---|
| Win rate | The share of winning trades from a sample of 30 or more in the journal | Taking it from the strategy description, where it was calculated without your violations |
| Risk/reward ratio | The average winner ÷ the average loser, by fact | Taking a planned 1:3 instead of an actual 1:1.2 |
| Risk per trade | The maximum, not the average: loss at the stop ÷ equity | Taking the one written in the plan, although the actual one is higher |
| Costs | Spread, commission and swap from your own account specification | Taking showcase values instead of actual ones from the statement |
| Distance | How many trades you really make in a year | Setting 1,000 when the actual figure is 150 — the model then shows somebody else's life |
| Stopping threshold | The drawdown after which you will stop trading by the rules | Setting 50 % while actually breaking at 20 % |
About the last row. The stopping threshold is worth defining honestly and in advance. The drawdown after which a person stops following the rules is almost always smaller than the one they name theoretically: for most people it is 20–30 %, not 50. A model built on an inflated threshold shows the survival of an account you would already have abandoned.
The order of calculations: what to work out first and what later
Calculating everything in a row is pointless: some calculations only make sense after others. Below is the order in which each next one rests on the conclusion of the previous.
Break-even win rate: we compare your actual one with the threshold at your ratio and costs. If it is below, it is too early to calculate the rest.
step 1Losing trades in a row: we check whether what stopped you was a routine event. Half of the «the system is broken» questions close here.
step 2Risk of ruin: the probability of reaching your drawdown threshold at the current risk per trade.
step 3The cost of overtrading: the share of costs in the risk and the overpayment for extra trades. It affects the threshold from step one.
step 4The cost of revenge trading and the cost of a drawdown: the price of reacting to a loss and the price of recovery.
step 5The breakdown map: where to start if there is nothing to calculate yet or there is no journal.
step 6The first three steps take an evening and answer the main question: is the problem in the system or in the behaviour. All the conclusions of these calculations and the assumptions adopted are collected on the methodology page.
What the calculations do not replace
A calculator answers the question «what follows from these numbers». The questions it does not answer are worth naming outright — otherwise the wrong things are expected of the tool.
The last row is the purpose of the section. We do not claim that calculation matters more than experience; we claim that some questions have an unambiguous answer, and discussing them in the genre of opinions is a waste of time.
Frequently asked questions
Do these calculators predict income?
No. They show what follows from your inputs by the formula. The inputs are a hypothesis: the win rate and the risk/reward ratio have to be taken from your own statistics, not from what you would like. More detail is in the methodology.
Where do I get the win rate and the risk/reward ratio?
From the journal, on a sample of thirty or more trades. Before that any calculation is an exercise rather than an assessment of your system.
Why is there no position-size calculator?
There is one, but it is built into the formula given on the pages: size = (deposit × risk %) ÷ (distance to the stop × point value). A separate page for it would duplicate the materials where that formula is already explained.
Read next
