 APTF
APTFRisk of ruin on forex
Positive expectancy does not guarantee that the account survives to see it. Risk of ruin on forex is the probability of reaching a given drawdown before the system's edge shows itself. It is the main number when choosing position size, and it almost always turns out higher than it seems.
Calculation: 8,000 scenarios of the given number of trades, risk as a percentage of current equity. The account counts as lost on reaching the drawdown threshold from the high — the scenario stops there. A random number generator with a constant seed: identical inputs always give an identical answer.
The probability of blowing a forex account: why this is a simulation, not a formula
The classical risk-of-ruin formula was derived for fixed-size stakes and for ruin as reaching zero. Neither holds here: risk is taken as a percentage of current equity, so the account formally never reaches zero, while «ruin» is better understood as the drawdown after which a person stops trading.
equity after a trade = equity × (1 − risk) on a loss
the scenario stops when (high − equity) ÷ high ≥ threshold
The result is shown as a median, not a mean. The mean across scenarios is pulled up by rare lucky paths: at high risk it produced «an average result of +1,069 %» while nine accounts out of ten did not survive to the end of the distance. The median describes the typical outcome more honestly.
A table: the same edge, different position sizes
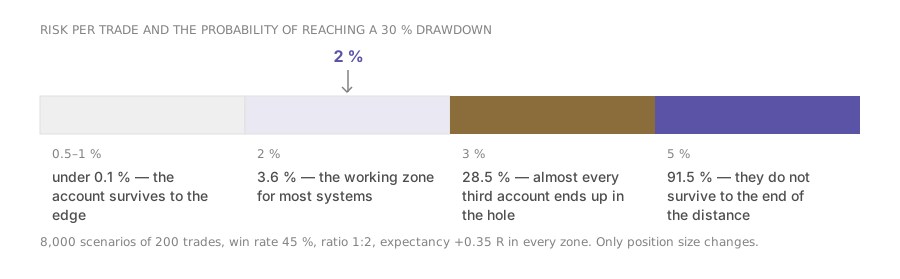
Win rate 45 %, ratio 1:2, distance 200 trades, ruin threshold a 30 % drawdown. The expectancy per trade is identical in every row: +0.35 R.
| Risk per trade | Risk of reaching −30 % | Median result | Average maximum drawdown |
|---|---|---|---|
| 0.5 % | under 0.1 % | +41 % | 5.0 % |
| 1 % | under 0.1 % | +97 % | 9.7 % |
| 2 % | 3.6 % | +270 % | 18.6 % |
| 3 % | 28.5 % | +508 % | 25.4 % |
| 5 % | 91.5 % | +110 % | 30.5 % |
This is not a forecast of returns. The edge in the model is given by the terms of the problem: it is assumed that you have it and that it holds for two hundred trades in a row. In life that is the strongest assumption of all. What to look at here is not the result column but how the outer columns behave with the expectancy unchanged.
The last row is the most useful observation in the table. At 5 % risk the median result is lower than at 3 %, although the expectancy is the same: nine accounts out of ten reach the threshold and stop. Increasing position size raises both the speed and the probability of dropping out — and the second grows faster.
How to use this when choosing risk
Not «how much am I theoretically prepared to lose» but «after what drawdown will I stop trading by the rules». For most people that is 20–30 %, not 50.
step 1From a sample of thirty or more trades and by fact, not by plan. The planned ratio is almost always higher than the actual one.
step 2A sensible guide is no more than a 5 % chance of reaching the threshold over the distance you plan to trade in a year.
step 3If the risk in dollars wanders from trade to trade in the journal, the calculation is meaningless: what has to be used is the maximum, not the average.
step 4What to do with the result of the calculation
The number by itself is not a decision. Below is what it means and what action follows from it, depending on the range.
3 % → 28.5 %, 1.5 % → about 2 % at the same win rate, ratio and distance
The non-linearity in the last formula is the main practical idea of the page. Intuition suggests that half the risk gives half the chance of trouble; in fact the gain is an order of magnitude larger. It is for exactly this reason that experienced traders trade sizes that look unjustifiably modest to beginners.
Limits of the model: what the calculation does not account for
The model is for an order of magnitude, not for a precise forecast. Below are all the assumptions built into it and the direction in which each shifts the result.
| Assumption | How it is in life | Which way it shifts the answer |
|---|---|---|
| Trades are independent | They are linked through the market regime: unfavourable conditions come in runs | The real risk is higher than calculated |
| The win rate is constant | It changes over time and after edits to the system | The real risk is higher than calculated |
| Risk is strictly fixed | It wanders: a spread of 2–3 times is common | The real risk is higher than calculated |
| Costs are not counted separately | They are inside the risk/reward ratio if that ratio is taken from actual results | Neutral with correct inputs |
| The drawdown threshold is observed | Some traders keep trading past the threshold | Real losses are greater than modelled |
| There are no top-ups to the account | Topping up after a loss is typical behaviour | Real losses are greater than modelled |
From the one-sidedness of the shifts follows a simple rule for reading it: the number you get should be treated as a lower bound. If the calculator shows 5 %, the real figure is more likely higher than lower. The full list of assumptions for all the site's calculations is on the methodology page.
Frequently asked questions
What is risk of ruin in plain words?
The probability of losing the account before the system has time to show its edge. It depends on three things: the size of risk per trade, the quality of the system and the length of the distance. Of these the first changes fastest — which is why it is where people start.
Why is the answer always bad with negative expectancy?
Because with negative expectancy ruin is a question of time, not of probability. Reducing risk stretches out the timeline but does not change the outcome. In that case the work has to go into the strategy, not into position size.
How far can the model be trusted?
It gives an order of magnitude, not a precise number. The main assumptions: trades are independent, the win rate and the ratio are constant, risk is strictly fixed. In reality all three are violated, and usually not in your favour — meaning the actual risk of ruin is higher than calculated.
What risk per trade counts as sensible?
There is no universal answer: it depends on your win rate, your ratio and your threshold. But the pattern is stable — the probability of a deep drawdown grows faster than the median result, so increasing risk almost always costs more than it appears from returns alone.
Read next
