 APTF
APTFHow to recover a forex deposit after a drawdown
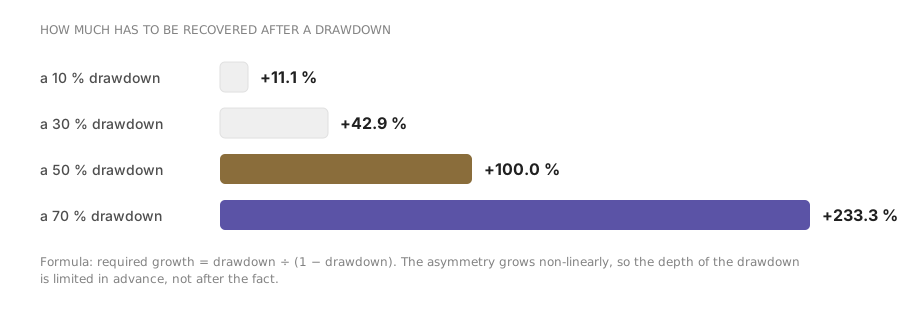
How to recover a forex deposit after a drawdown is a question of arithmetic, and the arithmetic is asymmetric: a fall of 50 % requires growth of 100 %, while a fall of 20 % requires only 25 %. It is precisely this asymmetry that explains why limiting losses matters more than increasing profits, and why after a deep drawdown an account most often does not come back.
«Winning trades in a row» is the ideal scenario without a single stop. «Trades at your expectancy» is a realistic estimate allowing for the win rate.
The recovery formula
drawdown 30 %: 0.30 ÷ 0.70 = 0.429 = +42.9 %
drawdown 50 %: 0.50 ÷ 0.50 = 1.000 = +100 %
drawdown 80 %: 0.80 ÷ 0.20 = 4.000 = +400 %
The asymmetry grows non-linearly: the first twenty percent of drawdown cost a quarter in growth, the last twenty (from 60 % to 80 %) cost another 250 percentage points on top. Hence a practical rule: the depth of a drawdown has to be limited in advance, because beyond a certain mark recovery stops being a realistic task.
| Drawdown | Growth required | Trades at an expectancy of +0.35 R and 1 % risk |
|---|---|---|
| 10 % | +11.1 % | ≈ 31 |
| 20 % | +25.0 % | ≈ 66 |
| 30 % | +42.9 % | ≈ 105 |
| 50 % | +100.0 % | ≈ 205 |
| 70 % | +233.3 % | ≈ 356 |
| 90 % | +900.0 % | ≈ 681 |
The number of trades is calculated with compounding: at an expectancy of +0.35 R and 1 % risk the average logarithmic gain is about 0.0035 per trade. This is a median estimate, not a guaranteed timeline.
Why a drawdown hits psychology harder than it hits the account
Behaviour is added to the arithmetic, and it is usually behaviour that turns a moderate drawdown into a deep one.
The timeline of «how long to get it back» feels unbearable, and the only available lever is to increase risk. Hence revenge trading, which deepens the drawdown instead of recovering it.
accelerationThe rules start to look broken exactly when following them matters most. Usually this is the middle of a routine losing streak, not a failure.
doubtA new setup, another timeframe, another instrument. The statistics reset, and assessing what works becomes impossible.
loss of dataWhat to write down in advance. Two depth marks: at the first (10 % for example) size is halved, at the second (20 % for example) trading stops until the statistics are reviewed. Both rules must fire automatically: during a drawdown decisions are made at their worst.
Two depth marks: when to reduce size and when to stop
A drawdown is manageable while it is shallow. Below is a construction of two thresholds that fires automatically and requires no decision at the moment when decisions are made worst.
| Mark | What happens | Why exactly this way |
|---|---|---|
| −10 % from the high | Risk per trade is halved | Half risk lengthens the distance: reaching −20 % now takes twice as many losing trades, and there is more time for a review |
| −20 % from the high | Trading stops until the statistics are reviewed | Recovering from here requires +25 %, which is already 65 trades at an expectancy of +0.35 R — it makes sense to check whether the system works |
| Return to −5 % | Risk returns to the base level | Automatically, without discussion: a decision to raise risk must not be taken during a drawdown |
at half risk of 0.5 % it takes about 22
reducing size during a drawdown buys time, not returns
The phrase «buys time» is precise here. Half risk does not make the system more profitable and does not speed up the recovery — it gives twice as many trades before the next mark. That is usually enough for a routine losing streak to end on its own.
Recovery at different expectancies: what it means in calendar time
The number of trades converts into weeks through your trading frequency. It is precisely this conversion that usually turns out to be the unpleasant surprise.
| Drawdown | Growth required | Trades at +0.35 R and 1 % risk | That is, at 10 trades a week | At 3 trades a week |
|---|---|---|---|---|
| 10 % | +11.1 % | 31 | 3 weeks | 2.5 months |
| 20 % | +25.0 % | 66 | 1.5 months | 5 months |
| 30 % | +42.9 % | 105 | 2.5 months | 8 months |
| 50 % | +100.0 % | 205 | 5 months | 1.3 years |
The last row explains why a drawdown of half an account is rarely recovered. A year and more to return to the previous mark is a timeline few people endure: long before it ends the urge to speed up appears, and the only available way to speed up is to raise risk. The rest of the scenario is known.
Forex account drawdown and equity drawdown: different numbers
The terminal shows two quantities, and stopping rules have to be set by the second. The difference is whether the floating result of open positions is included.
Two drawdown metrics
it is calculated from the peak, not from the initial deposit: an account may have doubled and fallen by a third while staying above its start
The difference between the two metrics is especially visible for those who sit through losses. In that case the balance can show a flat line for months while equity goes down — and a stopping rule set by balance never fires at all.
Frequently asked questions
What drawdown counts as normal?
It depends on the risk per trade and the win rate, not on a general rule. A practical guide: calculate the average maximum drawdown for your parameters in the risk-of-ruin calculation and compare it with the actual one. If the actual is noticeably larger, the market is not the problem — violations are.
Should drawdown be counted from the deposit or from the high?
From the equity high. A drawdown from the initial deposit does not show the loss: an account may have doubled and fallen by a third while staying above its starting point.
Is it worth increasing risk to get out of a drawdown faster?
No. That is exactly the scenario that turns 20 % into 50 %: increased risk speeds up movement in both directions, and the probability of reaching a deep drawdown grows faster than the median result. The calculation is on the page about overconfidence.
Read next
