 APTF
APTFLosing trades in a row on forex
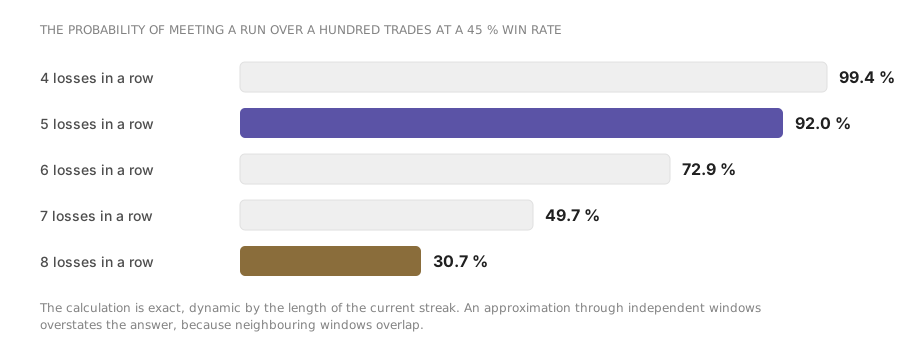
A run of losing trades on forex feels like a breakdown of the system, and it is at exactly that moment that people most often change the rules or increase size. The calculator shows how ordinary such a run is: at a 45 % win rate five losses in a row over a hundred trades occur in 92 cases out of a hundred.
The chart shows the probability of meeting a run of length 1 to 12 over the given distance. The calculation is exact, not approximate.
How this is calculated on forex
The naive formula «1 − (1 − q^K)^(N − K + 1)» overstates the answer: it treats the windows as independent, although neighbouring windows overlap. The correct method is a dynamic over the length of the current run.
after a winning trade the run resets, after a losing one it grows by 1
answer = 1 − the probability of never reaching length K
The expected number of runs is calculated separately, by the number of possible starts: a run of exactly length K begins either with the first trade or after a winning one. Hence the estimate (N − K) · qᴷ · (1 − q) + qᴷ, where q is the share of losing trades.
A ready table for typical win rates
The probability of meeting a run of the given length over a distance of a hundred trades. Worth pinning next to the monitor.
| Win rate | 4 in a row | 5 in a row | 6 in a row | 7 in a row | 8 in a row |
|---|---|---|---|---|---|
| 40 % | 99.9 % | 97.6 % | 87.3 % | 68.9 % | 49.0 % |
| 45 % | 99.4 % | 92.0 % | 72.9 % | 49.7 % | 30.7 % |
| 50 % | 97.3 % | 81.0 % | 54.6 % | 31.8 % | 17.0 % |
| 55 % | 91.5 % | 64.7 % | 36.3 % | 17.9 % | 8.4 % |
| 60 % | 80.1 % | 45.9 % | 21.2 % | 8.9 % | 3.6 % |
It reads like this: at a 50 % win rate a run of six losses in a row will occur in roughly every second hundred trades. Not «perhaps, if you are unlucky», but exactly at that frequency — it is a property of a random sequence, not of your system.
What to do about it in practice
How to choose a stop-day threshold from this table
The number of stops in a row after which the day closes is not a matter of taste. It is chosen so that the rule fires rarely enough not to become an obstacle.
| Stop-day threshold | How often it fires at a 45 % win rate | Trades cut off per month | Who it suits |
|---|---|---|---|
| After 1 stop | every second trading day | many | Position traders: 1–2 trades a week |
| After 2 stops in a row | roughly every third day | 5–7 | Daily traders: 1–3 trades a day |
| After 3 stops in a row | roughly once a week | 2–3 | Intraday traders: 3–8 trades |
| After 4 stops in a row | roughly once a fortnight | 1–2 | Scalping: 10+ trades |
The selection logic is simple: the rule has to cut off the worst trades, not most of the trades. If the threshold fires more often than on a third of trading days, it is either too tight or your risk per trade is too large — the second is more common.
state = the length of the current losing run, from 0 to K−1
a winning trade resets the state, a losing one increases it by 1
What a run does to equity at different risk levels
The probability of a run does not depend on position size, while its price depends on it entirely. These are two different quantities, and confusing them is expensive.
| Length of the run | Risk 0.5 % | Risk 1 % | Risk 2 % | Risk 3 % |
|---|---|---|---|---|
| 3 in a row | −1.5 % | −3.0 % | −5.9 % | −8.7 % |
| 5 in a row | −2.5 % | −4.9 % | −9.6 % | −14.1 % |
| 7 in a row | −3.4 % | −6.8 % | −13.2 % | −19.2 % |
| 10 in a row | −4.9 % | −9.6 % | −18.3 % | −26.3 % |
The bottom right cell is the answer to why three percent risk counts as high despite arithmetic that looks harmless. A run of ten stops at a 45 % win rate occurs over a hundred trades in roughly one case in ten — that is, it will certainly arrive once every few years. At 0.5 % risk that is a five percent nuisance; at 3 % it is a quarter of the account.
A run of winners: the same arithmetic in the other direction
The calculation is symmetric, and its second half is discussed less often although it costs no less. A run of winners is exactly as random as a run of losers and produces exactly the same wrong conclusions — only with the opposite sign.
| Event | Probability over 100 trades at a 45 % win rate | What conclusion people draw | What conclusion is correct |
|---|---|---|---|
| 5 losses in a row | 92.0 % | «The system is broken» | A routine event, do not touch the rules |
| 5 wins in a row | 64.7 % | «I have understood the market» | A routine event, do not touch the size |
| 8 losses in a row | 30.7 % | «Time to change strategy» | Once every three hundred trades — plan for it in advance |
| 8 wins in a row | 8.4 % | «I can risk more» | Rare but random: the edge has not changed |
The second and fourth rows are the mechanics of euphoria. A run of five winners occurs in almost two thirds of hundred-trade stretches, that is, with practically everyone and regularly. The conclusion «the system has started working, I can be bolder» does not follow from it any more than the conclusion «the system is broken» follows from a run of losers.
Frequently asked questions
Does the calculation allow for trades not being entirely independent?
No, and that is the model's main assumption. Real trades can be linked through the market regime: in a certain market phase unfavourable conditions for your setup come in runs. Because of that real runs are usually a little longer than calculated, meaning the model gives an optimistic estimate.
What counts as my win rate?
The share of winning trades from a sample of thirty or more in the journal. You cannot take the figure from a strategy description: there it was calculated on different data and without your violations.
How do you survive a run of stops?
Technically, by changing neither size nor rules and relying on these numbers. Psychologically it helps to know them in advance: a run you knew would happen is lived through in a fundamentally different way from an unexpected one. And the stop-day works: it stops a run turning into one bad evening.
Read next
