 APTF
APTFOvertrading on forex
Overtrading on forex is a systematic excess over the planned number of trades. It is less noticeable than the other mistakes: every individual trade looks normal, the risk in it is the planned one, the stop is in place. The problem appears in the sum — both in costs and in the quality of entries.
Overtrading on forex is about the number of trades, not the size
Overtrading is an excess over the planned number of trades at unchanged position size. Growth in size is a separate mistake with different mechanics. Below are four reasons the number of trades grows.
The most common reason. An hour at the chart without a single signal is hard to bear, and the bar of «looks like a setup» lowers itself.
no signal — but time on your handsAfter two winning trades a desire appears to make use of a «lucky day». That is euphoria in a mild form.
after the winnersAfter a loss — more attempts instead of more size. The same revenge trading, only distributed by quantity.
after the lossesTwenty pairs in the terminal guarantee that something is always moving somewhere. The number of setups grows mechanically, and so does the number of false ones.
a structural causeThe price of an extra trade on forex
Every trade starts at a loss equal to the costs. On the currency market there are three of them: spread, commission and the overnight swap.
0.2 lots: 0.2 × (1.2 × 10 + 7) + 0.2 × 3 × 1 = $4.40
| Indicator | Plan: 20 trades | Actual: 35 trades |
|---|---|---|
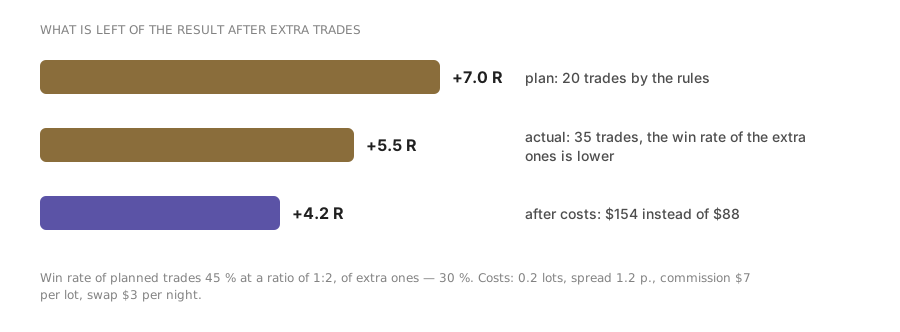
| Costs for the month | $88 | $154 |
| Overpayment | — | $66 |
| Per year | $1,056 | $1,848 |
| Overpayment per year against a $5,000 deposit | — | 15.8 % |
Fifteen percent of the deposit a year — just for the right to make fifteen extra trades a month. And that is without their result: if the extra trades are outside the setup, a negative expectancy on them is added to the costs.
over the distance this is subtracted from every result
The second effect: the quality of entries falls
Costs are only half the price. The other half is that extra trades are by definition made in situations where the setup conditions are not fully met.
| The planned 20 trades | The extra 15 trades | Total 35 | |
|---|---|---|---|
| Win rate | 45 % | 30 % | 38.6 % |
| Expectancy per trade | +0.35 R | −0.10 R | +0.16 R |
| Result for the month | +7.0 R | −1.5 R | +5.5 R |
The win rate of the extra trades is taken below the planned one: that is an assumption, but it follows from the definition itself — extra means trades that are not in the plan. Exact values are individual and are taken from the journal, where trades are split into «by the rules» and «not by the rules».
The bottom line: fifteen extra trades ate one and a half R of the result and another $66 in costs. Meanwhile the person looking at the month sees a plus and does not notice that the plus could have been one and a half times larger.
Four limits against overtrading
- A limit on trades per day
- A hard number from the plan. After it the terminal closes regardless of the result — that is part of the stop-day.
- A short list of instruments
- Two or three pairs. Shortening the list reduces the number of setups mechanically, without any willpower.
- Pending orders instead of watching
- An order at a level fills by itself. The main source of extra entries is removed — time spent at the chart.
- A trading window instead of «while it is running»
- An hour and a half to two hours with a fixed start and end. The breakdown is in the material on routine and sessions.
How many trades your system actually needs
The norm for the number of trades is not derived from general considerations — it follows from the frequency of setups. It can be calculated on a month of history, and it almost always turns out to be lower than the actual figure.
3 setups a month per pair × 2 pairs × 1.0 = 6 trades a month
if there are actually 20, fourteen were not taken by the system
| Style | Setups per pair per month | Pairs traded | Planned trades | Typical actual |
|---|---|---|---|---|
| Position | 1–2 | 3–5 | 5–8 | 12–20 |
| Daily | 3–5 | 2–3 | 8–14 | 25–40 |
| Intraday | 10–20 | 1–2 | 15–35 | 50–90 |
| Scalping | by the session schedule | 1 | by time, not by setups | — |
The gap between the two right-hand columns is overtrading in its pure form. Note that it grows as the timeframe shrinks: the more often a system gives signals, the harder it is to tell signal from noise and the more trades are made «almost by the rules».
Costs as a percentage of risk: why this is the key quantity
The absolute sum of the costs tells you nothing. What matters is their share of your risk: it is that share which enters the break-even win rate formula and determines how many winning trades a system needs.
stop 25 pts, 0.2 lots: 4.40 ÷ 50 = 8.8 %
stop 10 pts, 0.2 lots: 4.40 ÷ 20 = 22.0 %
the break-even win rate at 1:2 rises from 36.3 % to 40.7 %
Hence a rule that is rarely stated outright: the frequency of trades and the closeness of the stop are linked. A system with a short stop requires a higher win rate because of the costs alone, and overtrading adds trades outside the setup on top, whose win rate is knowingly lower. The two causes add up, and the month's result goes negative with a strategy that formally works.
Frequently asked questions
How many trades a day is normal?
It depends on the strategy, not on a norm: a position trader may have one a week, a scalper thirty a day. The sign of overtrading is not an absolute number but exceeding your own plan and a falling share of trades by the rules.
How do you know a trade is an extra one?
By the checklist: if even one point is passed at a stretch, the trade is an extra one. Mark such trades separately in the journal — within a month their result will be visible in figures, and the question will close itself.
Does moving to a higher timeframe help?
It does, because it physically reduces the number of signals. But that is a change of strategy rather than work on behaviour: if the cause is boredom or revenge trading, it will show up on the higher timeframe too, only more slowly.
Does an increase in size count as overtrading?
No, that is a separate mistake. Overtrading is about the number of trades at planned size; growth in size is about greed and revenge trading. They are treated by different rules, which is why it is useful to tell them apart.
Read next
