 APTF
APTFOverconfidence in a forex trader and euphoria
The state after a run of winning trades is not perceived as a problem — on the contrary, it feels like earned confidence. That is exactly why excessive overconfidence in a forex trader costs more than fear: fear is visible and gets in the way, while euphoria helps you feel good right up to a large loss.
Euphoria after profit on forex: why size grows
Three mechanisms work at once, and all three look rational from the inside.
Profit is explained by skill, loss by circumstances. While the run continues it feels as though you have «understood the market», although what changed is the sample, not the understanding.
overestimating the edgeProfit on the account feels not quite your own, and risking it is psychologically easier. Hence the wording «I will risk what I have earned» — arithmetically it is no different from «I will risk the deposit».
a rise in acceptable riskThe last five trades are remembered more vividly than the previous fifty. An estimate of your own win rate after a good week is consistently too high.
the recency effectThe result: size grows gradually and without a single conscious decision. Someone who raised risk from 1 % to 3 % over a month usually cannot name the day when they decided it.
What an unnoticed rise in risk costs
Take one and the same system — a 45 % win rate, a 1:2 risk/reward ratio — and look at what changing only position size does. The expectancy per trade is identical in every row: +0.35 R.
| Risk per trade | Median result over 200 trades | Average maximum drawdown | Risk of reaching a 30 % drawdown |
|---|---|---|---|
| 0.5 % | +41 % | 5.0 % | under 0.1 % |
| 1 % | +97 % | 9.7 % | under 0.1 % |
| 2 % | +270 % | 18.6 % | 3.6 % |
| 3 % | +508 % | 25.4 % | 28.5 % |
| 5 % | +110 % | 30.5 % | 91.5 % |
This is not a forecast of returns. In the model the system's edge is given by the terms of the problem — it is assumed that you already have it and that it holds for two hundred trades in a row. In life that is the strongest of all the assumptions. What to look at here is not the result column but how the two right-hand columns behave with the expectancy unchanged.
The most interesting row is the last one. At 5 % risk the median result is lower than at 3 %, although the expectancy per trade is the same. The reason is that nine accounts out of ten reach a 30 % drawdown and stop: they simply do not live long enough for the positive expectancy. Raising risk increases not only the speed of movement but also the probability of dropping out of the distance — and the second quantity grows faster.
Calculation: 8,000 scenarios of 200 trades, a fixed risk percentage of current equity, the account counted as lost at a 30 % drawdown from its high. A random number generator with a constant seed, so the same inputs always give the same answer. Your own numbers go into the risk-of-ruin calculator.
The rule that limits euphoria
The wording. The base risk per trade changes no more often than once per calendar month, in steps of no more than 25 % of the current value, and only on the basis of statistics over a period of no fewer than thirty trades. On a drawdown of a set depth the risk returns to its previous value automatically.
Why exactly this way
- Once a month
- Rare enough that the decision does not fall under the influence of the last week, and frequent enough that scaling is not held back.
- A step of 25 %
- The change is noticeable over the distance and unnoticeable on an individual trade. Doubling risk feels like a different market and provokes a breakdown.
- Thirty trades
- A smaller sample does not separate an edge from luck. This is not a strict statistical threshold but a practical minimum below which the spread covers the effect.
- Automatic rollback
- Returning to the previous risk must not require a decision: during a drawdown decisions are made at their worst.
Signs of euphoria that are visible from outside
How size grows unnoticed: eleven weeks taken apart
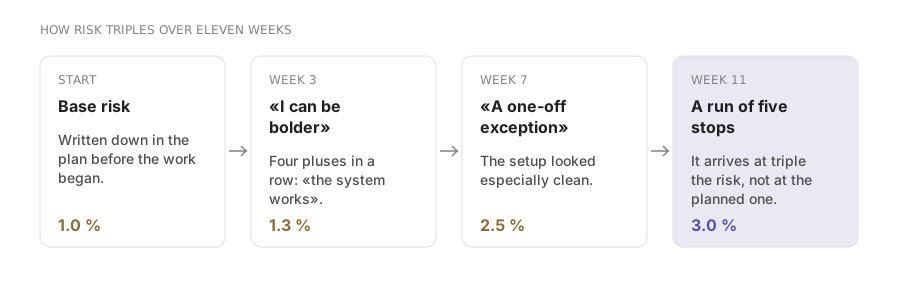
Nobody decides «I will triple my risk». The growth goes in steps, each of which looks sensible on its own. Below is a typical trajectory from journal records.
| Moment | What happened | The argument at that moment | Risk per trade |
|---|---|---|---|
| Start | Base risk recorded | — | 1.0 % |
| Week 3 | Four winners in a row | «The system works, I can be bolder» | 1.3 % |
| Week 5 | Best month | «I have already made back the early losses» | 1.7 % |
| Week 7 | A «particularly clean» setup | «A one-off exception» | 2.5 % |
| Week 9 | A profitable week | «I am risking what I earned» | 3.0 % |
| Week 11 | A run of five stops | — | 3.0 % |
The last row is the moment the table was built for. A run of five stops at a 45 % win rate occurs with a probability of 92 % over a hundred trades — that is, it arrives without fail. At the recorded risk of 1 % it costs 4.9 % of equity, at the actual 3 % it costs 14.1 %. The difference was created neither by the strategy nor by the market.
risk 1 %, five stops: 1 − 0.99⁵ = 4.9 %
risk 3 %, five stops: 1 − 0.97⁵ = 14.1 %
A scaling rule you can actually follow
Limiting euphoria works only in a form where growth in size turns from a decision into a procedure. Below is the working wording in full; you can move it into your own plan and substitute your own numbers.
- Frequency
- Risk is reviewed once per calendar month, on the first Saturday. Between those dates it does not change whatever the result.
- Step
- No more than 25 % of the current value: from 1.0 % you may move to 1.25 %, but not to 1.5 %.
- Condition for raising
- A sample of no fewer than thirty trades with a rule-following share of 90 % or more and a positive result on «by the rules» trades.
- Condition for lowering
- A 10 % drawdown from the equity high returns risk to the previous step automatically, with no discussion and without waiting for Saturday.
- Ceiling
- The upper bound of risk is written down in advance and reviewed no more often than once a year. Without a ceiling the step rule by itself limits nothing.
- Record
- Every change is fixed in the journal with a date and a reason. The absence of a record means there was no change — and the current risk must match the last record.
A two-minute self-check. Open your journal and find the date of the last deliberate change of risk. Then calculate the actual risk of the last ten trades. If the numbers do not match, size grew by itself — and that is exactly the case this page examines.
Frequently asked questions
Does a trader not need confidence?
You need confidence in the system over the distance, not in a particular trade. The first lets you accept stops calmly, the second stops you placing them. Telling them apart in practice is easy: confidence in the system does not change the size of an individual trade, confidence in a trade does.
Why does the largest loss often come after the best run?
Because by the time of the large loss size has already been increased and control has weakened: the checklist is gone through as a formality, the entry is made faster. A run of winners causes no alarm, so no correction of behaviour takes place.
How do you scale an account without falling into euphoria?
Write the scaling rule down in advance and follow it mechanically: step, frequency, rollback condition. Then growth in size stops being a decision taken in an elevated mood.
What should you do right after a large profit?
Nothing. Precisely nothing: do not increase size, do not change the rules, do not enter additional trades the same day. Many traders close the day after a result above the daily norm — that is the mirror pair to a loss stop-day.
Read next
